

See it on a real chart
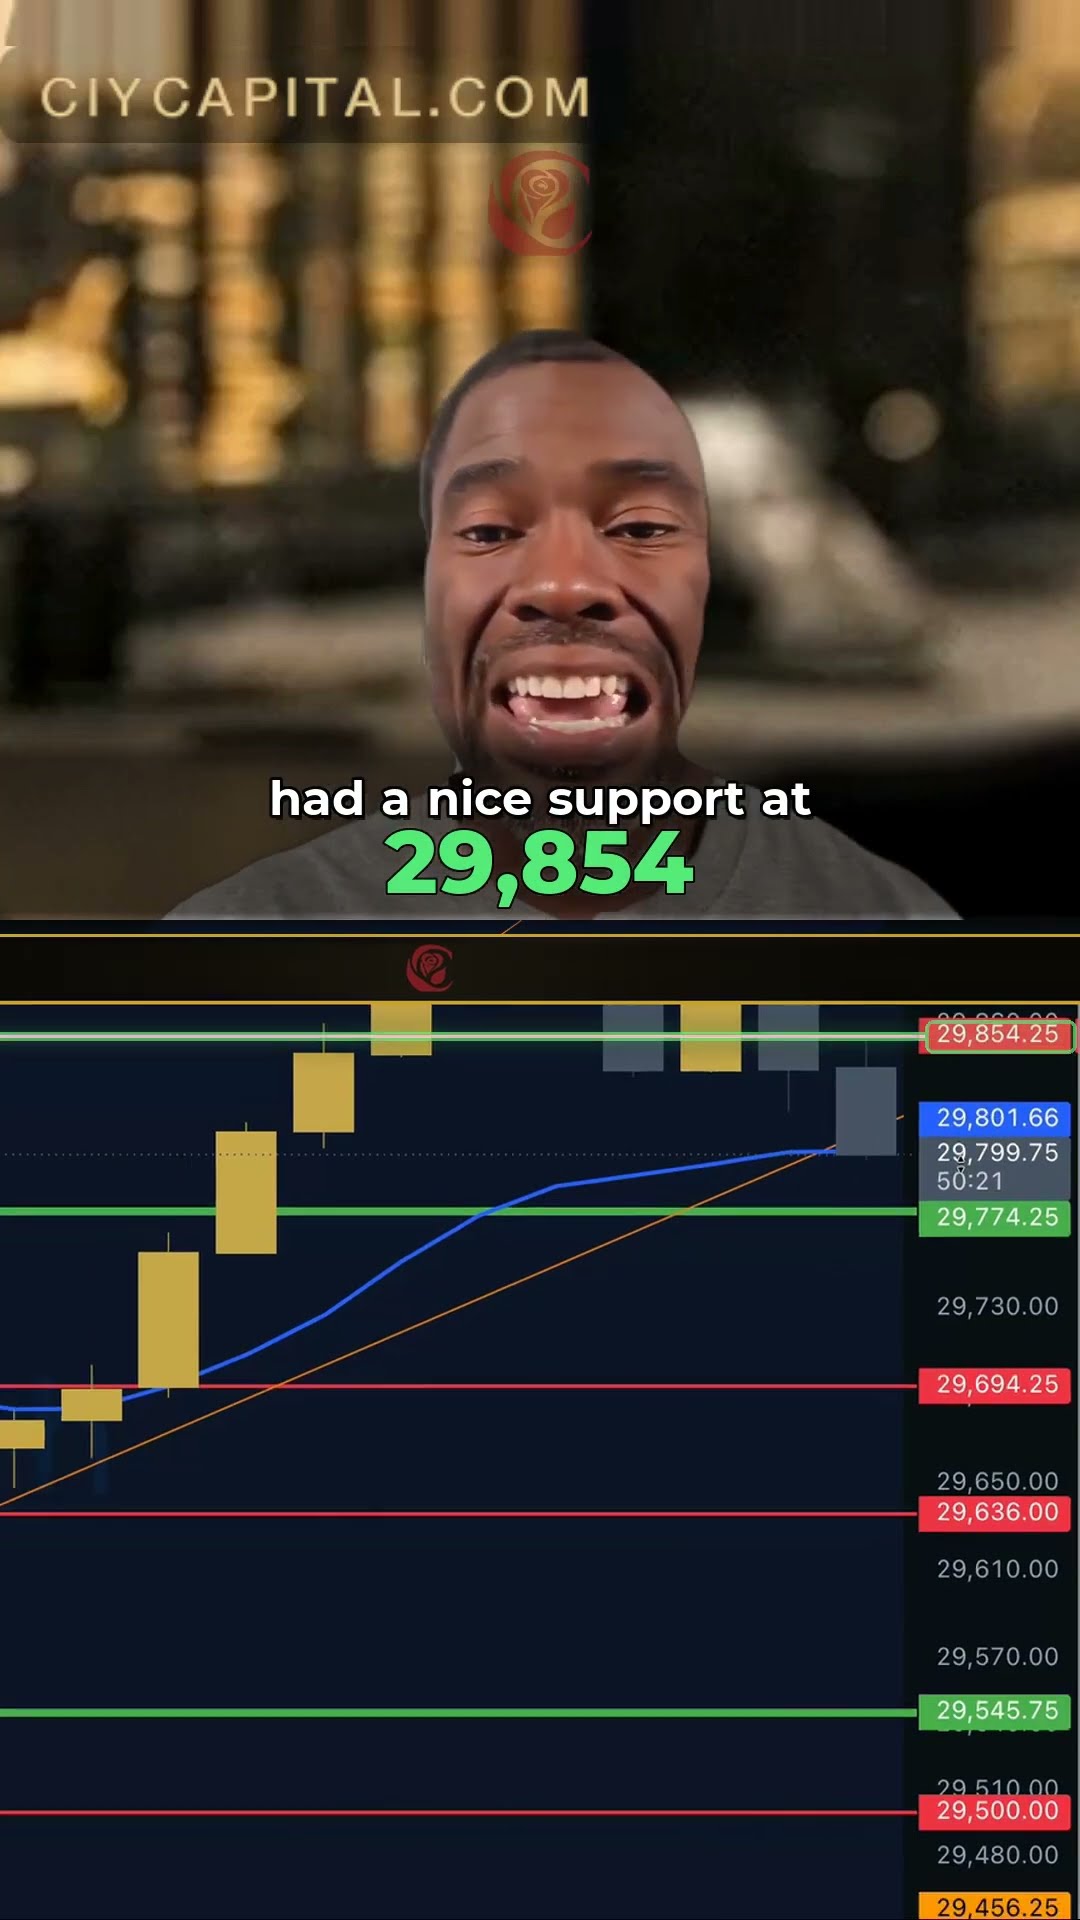
The same idea, live on the CIY Chart during the daily NQ prep. Each clip was recorded on the date shown, and the levels in it were for that session only.


The short version
- VWAP is the volume-weighted average price: the average price paid in the session, where prices with heavy volume count more.
- Above VWAP, the average buyer in the session is in profit. Below it, the average seller is. That is why price so often reacts there.
- Use it as a decision line: a reclaim or a rejection at VWAP tells you which branch of the plan is in play.
- It is a reference, not a signal. In a choppy session price can cross it again and again.
Do this before the next open
On tomorrow's NQ chart, note where price sits against VWAP at 9:30, then mark every time it crosses VWAP in the first hour. Check whether those crosses happened at one of the day's levels on ciycapital.com/premarket.
Done with this lesson?
Mark it complete to log the rep and earn +45 XP. Progress saves to this browser.
Go deeperRead the full lesson
VWAP stands for volume-weighted average price. It answers one question: across everything traded so far this session, what was the average price paid? A plain average treats every bar the same. VWAP gives more weight to the prices where more contracts changed hands, because that is where the real business was done.
How it is calculated
- For each bar, multiply its price by the volume traded in it.
- Add those up from the start of the session, and add up the volume too.
- Divide the first total by the second. That is VWAP, and it updates with every bar.
- It resets at the start of each new session and begins counting again.
Why price reacts at it
Large desks often measure their own fills against VWAP, so it is a number many participants are watching at once. And it marks the balance point of the session: when price sits above it, the average position opened today is winning, and when it sits below, the average one is losing. Moves back to VWAP are where that balance gets tested.
How it gets used on the floor
- A line to clear. Price has to get back above VWAP, and then through the next level above it, before the upside half of the plan is live.
- A place to reject. When price rallies up into VWAP from below and fails there, the downside branch is the one in play.
- A tiebreaker with the trend. An uptrend on the one-hour chart with price holding above VWAP is two things agreeing. When they disagree, size down or wait.
Where it misleads
Early in the session VWAP is built from only a few bars, so it swings around and means little. On a directionless day price crosses it repeatedly and each cross looks like a signal. That is why it is always read together with the levels and the trend, and never on its own.
Education only. Nothing in this lesson is a signal or a recommendation to trade. Trading involves substantial risk of loss.